
PYX-Voice Leaderboard Refresh: What 13 New Models Tell Us About AI and Employee Surveys
KEY TAKEAWAYS: Adding to the July 2026 leaderboard of seven frontier models, the September 2026 PYX-Voice leaderboard refresh tested 13 additional large language models on 84 employee survey tasks. For the first time, we can report an upward trend: nine models surpassed July's best score of 76%. The field is converging at the top, with nine models clustered between 79 and 83%, making model selection less about raw scores and more about which capabilities fit your specific workflow. Newer models are meaningfully closing the gap between structured data analysis and thematic synthesis, but synthesis remains the weakest and most variable capability across the board. Every new model still produced critical failures in the form of overclaims, reinforcing that human oversight at key decision points is a requirement, not an optional add-on, for responsible AI adoption in this space.
Why are we refreshing the leaderboard already?
When we launched PYX-Voice in July 2026, the pace of AI development meant the landscape had already shifted by the time the ink was dry. New model families were releasing, existing models were updating, and practitioners in the HR and people analytics space were asking us which tools they could actually trust. That question is exactly what PYX-Voice was built to answer.
We've committed to refreshing the leaderboard quarterly, so we can track how the field evolves over time, document patterns that persist versus those that change, and offer up-to-date guidance to the people doing this work every day. This September refresh added 13 new models to the original seven, bringing the total to 20 frontier models evaluated across the same 84 tasks. Those tasks represent the real work of employee survey analysis: interpreting open-ended feedback, identifying themes, comparing demographic groups, running statistics, and flagging data quality issues: the full range of what HR practitioners and people scientists actually do with survey results.
Are frontier models actually getting better at employee survey work?
The short answer: yes, and meaningfully so.
In July 2026, the best-performing model was gemini-3.5-flash at 76% (95% CI: 66%–84%). In September, the top performer, muse-spark-1.1, scored 83% (95% CI: 74%–90%). More importantly, every model in the top nine outperformed July's best: muse-spark-1.1, gpt-5.6-sol, Kimi-K3, claude-opus-5, gemini-3.8-flash, muse-spark-1.3, DeepSeek-V4-Flash-0731, grok-4.6, and DeepSeek-V4-Pro-0813 all scored between 79 and 83%.
That clustering at the top is itself a finding worth pausing on. It signals that the performance gap between top-tier models is narrowing: the difference between first and ninth place is only four percentage points. For practitioners, this means the "which model should I use?" question is not as relevant. It's more about which one excels in the specific capabilities your workflow depends on most (or, more practically speaking, how to navigate the specific strengths and weaknesses of your preferred tool).
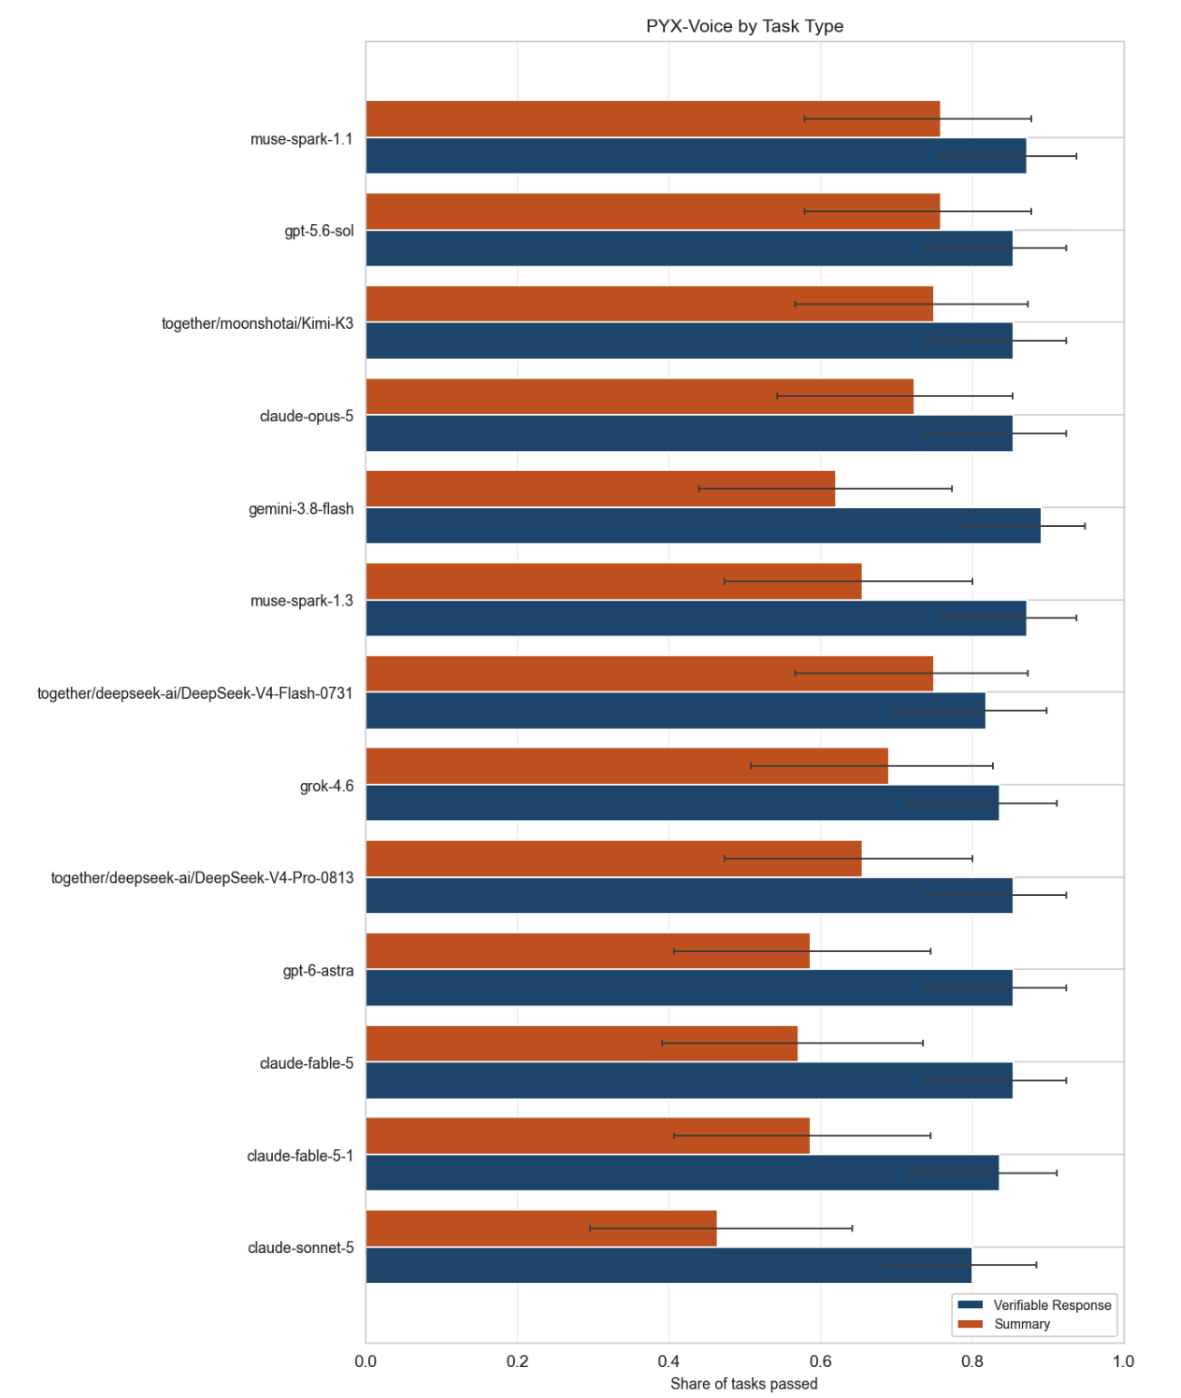
One particularly encouraging trend: models are getting better at the harder task type. Across the board, models perform better on Verifiable Response (VR) tasks (typically based on quantifiable metrics, these tasks have a binary correct or incorrect answer). Summary tasks, which require summarizing data to arrive at thematic conclusions, are more difficult for LLMs to pass. In July, a minimum 16-point gap between VR and Summary tasks existed for all tested models. In September, six models narrowed this gap between VR and Summary, with the most notable being DeepSeek-V4-Flash-0731 (7 points), gpt-5.6-sol (9 points), and Kimi-K3 (10 points). The ceiling is rising, and the harder, more interpretive work of summarizing thematic data is following it upward.
Which capabilities are strongest, and where do models still fall short?
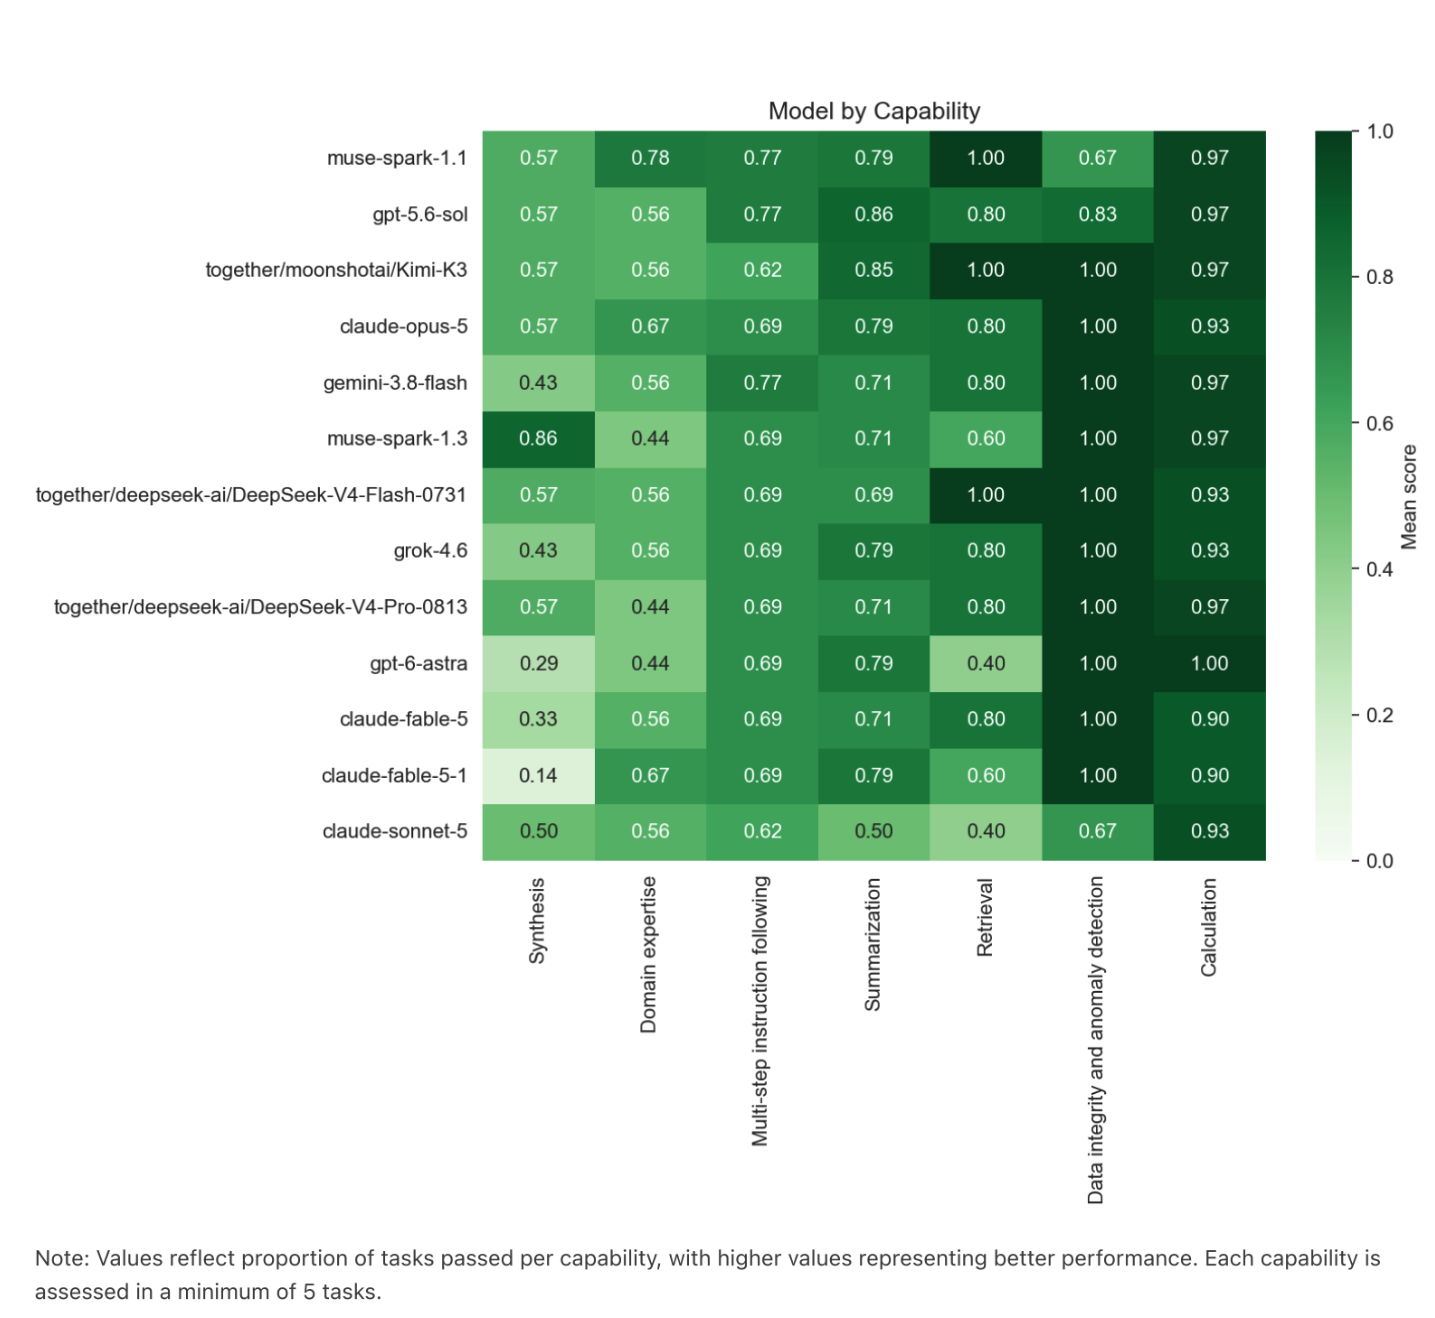
Across the 13 models tested this month, the capability hierarchy held steady from July: Calculation remains the strongest with the narrowest spread across models, with models reliably performing arithmetic-based tasks like benchmark comparisons and descriptive statistics. Interestingly, all but three models received a perfect score on data integrity and anomaly detection, six tasks designed to identify errors, inconsistencies, or irregularities in datasets. Multi-step instruction following showed the second-narrowest spread across models, meaning performance is relatively consistent: most models handle structured, sequential tasks similarly well.
Synthesis remained the weakest capability and also the most variable, spanning a remarkable range from 14% to 86% across models. Most of that spread is explained by one standout: muse-spark-1.3 passed 86% of Synthesis tasks (six out of seven), a full 29 percentage points ahead of the six-model cluster tied for second at 57%. Synthesis involves integrating quantitative and qualitative data with domain knowledge to produce action-oriented, stakeholder-relevant outputs. Essentially, this is the strategic insight work that HR leaders most want AI to do. The size of the gap between muse-spark-1.3 and everything else on this dimension is a preliminary finding, but a striking one that we'll continue to track.
The practical implication: If you have the chance to choose your model, know which capabilities your use case depends on, and evaluate accordingly. If you are already committed to your model, get to know where its strengths and weaknesses lie, and add a human-in-the-loop to handle the performance pitfalls.
Do some HR topic areas remain harder for AI to interpret than others?
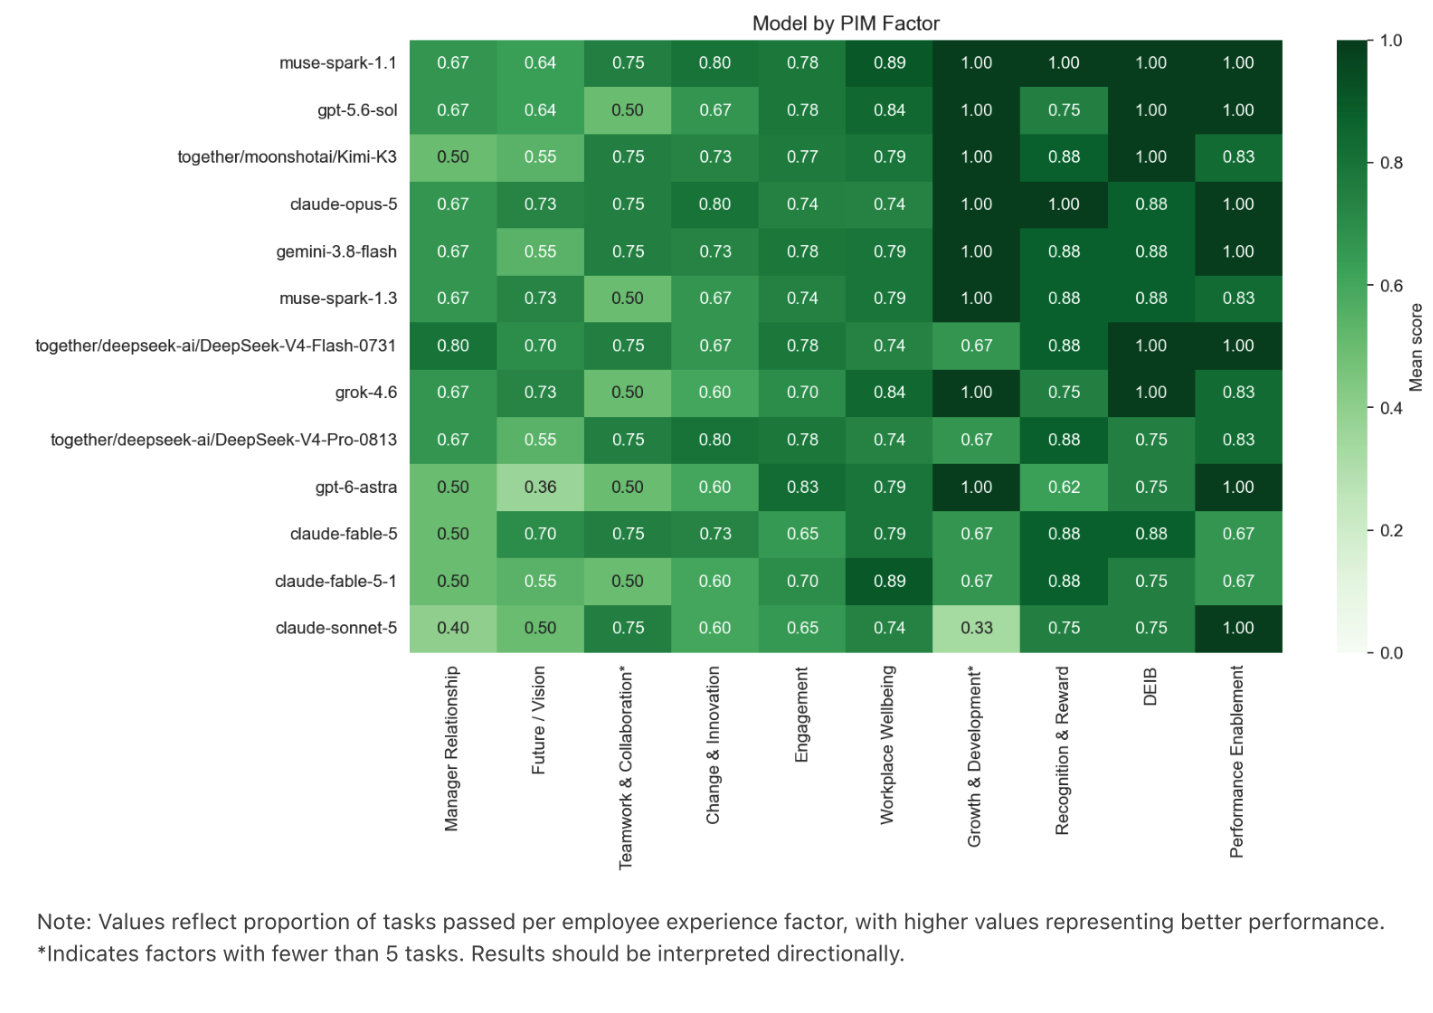
Consistent with the July findings, Performance Enablement and DEIB are the highest-performing content areas in September. Our interpretation of this remains that models perform best in employee experience areas that are well represented in publicly available content and tend to involve more structured language that is consistent across organizations.
Two notable shifts emerged this quarter. Growth & Development, although underrepresented in the benchmark tasks, showed clear improvement in newer models: eight of the new models passed all three available tasks in this content area. Although we hesitate to over-interpret findings based on three tasks, it's a notable and encouraging sign that newer models may be better equipped to handle developmental and career-related language in employee feedback contexts.
Manager Relationship tells a different story. It ranked sixth out of ten PIM factors in July, but dropped to last in September. This is not because model performance on it declined, but because everything else improved around it. Manager-related survey items tend to involve nuanced, contextual language about interpersonal dynamics that models may process differently than more structured employee experience topics.
Should practitioners be worried about AI making things up?
Yes, and the data are consistent on this point. Every single model tested in September produced at least one critical failure. The most common type was overclaiming: asserting findings or conclusions that go beyond what the data actually support. Nearly all models generated two overclaims across the 84 tasks; gemini-3.8-flash was the exception, producing just one.
Fabricated statistics, where a model invents a number that doesn't exist in the data, were less common but present. Claude-opus-5 produced two fabrications; claude-fable-5-1 produced one. No fabrications were detected for the remaining models.
This pattern reflects what Dunning-Kruger would call "confident incompetence." In this case, the concern is when models are right most of the time but occasionally wrong, there’s no visible signal that they're wrong. In an HR context, where a fabricated statistic about engagement levels or demographic differences could shape real organizational decisions, this is a non-trivial risk. As a result, fact-checking mechanisms are required for responsible use - which adds time and complexity that may counteract the benefits in efficiency that practitioners are hoping for.
What does this mean for HR teams adopting AI today?
The trajectory is encouraging, and there are a few actionable insights in these results for teams thinking carefully about AI adoption:
Lean on AI for calculations and structured analyses. Benchmark comparisons, descriptive statistics, response-based filtering, and demographic comparisons are areas where most models perform reliably, especially with well-crafted prompts. These are reasonable candidates for delegation, with a lightweight review step built in.
Keep humans in the loop for synthesis and interpretation. The most strategically valuable tasks like integrating findings into a coherent narrative and identifying what matters most for stakeholder action are still where AI falls shortest. Year-over-year trend analysis and driver analysis (identifying the experiential factors that predict highly engaged employees) also showed inconsistent performance across models, meaning complex, multi-layered analyses aren't ready for hands-off delegation just yet.
Build in a fact-check step by design. The consistency of overclaims across all 20 models suggests this isn't a model-specific quirk, but rather an inherent risk in delegating to LLMs. Design your AI-assisted workflows with explicit verification moments, particularly for any statistical claim that will be shared with leaders or embedded in a report that drives decision-making.
The tools available to HR practitioners today are meaningfully better than they were two months ago, and will be better still by the next refresh. The goal right now isn't to wait for perfect AI. It's to adopt with enough structure that you can trust what you're getting, catch what you can't, and build toward greater confidence over time.
PYX-Voice is PYX Labs' benchmark for evaluating large language model performance on employee survey analysis and interpretation tasks. Results reflect 84 in-scope tasks across Verifiable Response and Summary task types. Scores represent the share of tasks passed. Learn more at pyxlabs.ai.